Feed performance, 7 min read
Precision feeding, from fixed feeding tables to data-driven rations
How to move from fixed feeding tables to daily rations set by biomass, temperature, oxygen and appetite data, and where sensors and models can mislead.
The standard way to set a ration is a feeding table: a percentage of body weight looked up by fish size and water temperature, multiplied by the estimated biomass in the unit. The table is a sound forecast, but it is only a forecast. Appetite moves with oxygen, weather, health, handling and surface water that is colder or warmer than the water below.
The gap between table and appetite is expensive. In salmon farming, feed accounts for about half of total production costs from egg to market fish, and every meal is a trade-off between feeding enough for growth and losing pellets through the net. Precision feeding keeps the table but lets measured biomass, water conditions and feeding response correct it every day.
Feeding tables and the data that corrects them
Small fish eat more relative to their weight, and fish in warm water eat more than fish in cold water. A US extension guide for rainbow trout gives maximum rates of 1.5 to more than 6% of body weight per day in the optimum band of roughly 13 to 18 C, and only a maintenance ration of 0.5 to 1.8% at about 3 C and below. It tells growers to get a chart from the feed supplier for that formulation, calls such charts useful guides that need adjusting to the farm, and notes that fish usually need to be fed less than they will eat.
A table has two blind spots. It cannot see appetite on the day, which salmon researchers note is shaped by many internal and external factors that are hard to forecast. And because the ration is biomass multiplied by a rate, every error in the biomass estimate passes straight into the ration. Correcting both takes several data sources, each with its own way of failing.
| Data source | What it adds to the ration | Common failure |
|---|---|---|
| Growth sampling and counts | Average weight and numbers, the base of biomass | Unrepresentative samples, uncounted mortality |
| Biomass frames and stereo cameras | Frequent weight data without handling | Measures only fish that pass its location |
| Temperature and oxygen sensors | Why appetite should rise or fall | Fouling, missed calibration, one depth only |
| Feed delivery records | What each unit actually received | Feed logged to plan rather than as delivered |
| Cameras and pellet detection | When to slow or stop a meal | Limited field of view, turbid water, poor light |
| Hydroacoustics | Where the fish are during and after feeding | Needs resetting as fish grow and water stratifies |
Adaptive feeding in salmon cages
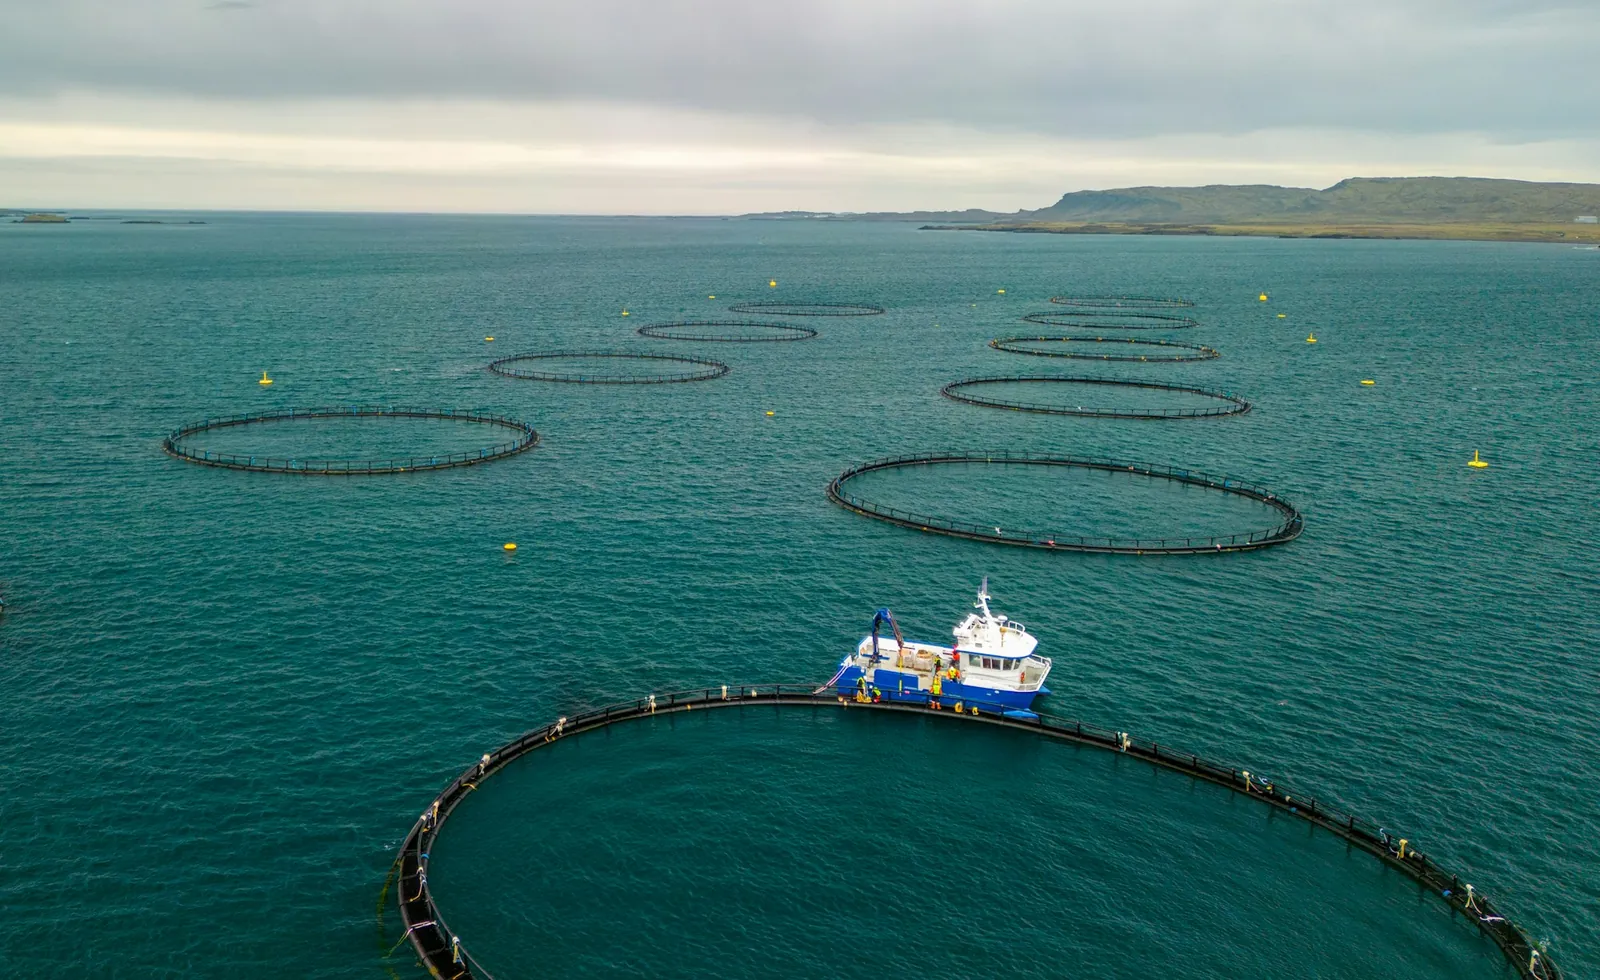
The usual control method in salmon cages is camera monitoring of feeding activity and pellet sinking depth, slowing or stopping the meal once pellets pass below the feeding zone. Researchers describe it as laborious and subjective, and note that farmers tend to overfeed to protect growth. A single revolving camera with about 5 m of visual range covers roughly 10% of the area of a 40 m diameter cage at one depth.
Hydroacoustic feeding control, or echofeeding, uses an upward-facing echo sounder to measure fish biomass in the feeding area. As fish become satiated they leave that zone, the echo falls below a set threshold, and software ends the meal. In trials in 3 research cages, with fish of about 900 g at about 14 C in summer and about 5.3 kg at about 5 C in winter, salmon learned to take their daily ration in about 1 hour. Appetite varied between meals and days, yet the system prevented waste feed while the fish kept growing strongly.
An 8-month follow-up at a stratified fjord site carries the more useful lesson. When surface water fell below 5 C over a strong halocline, echofed fish avoided the surface feeding zone and were underfed until the observation volume was set deeper; in spring, warming surface water drew fish up and blurred feeding with routine behaviour. The biomass threshold also had to be adjusted as the fish grew, while camera-based pellet detection below the surface layer coped better with the changing water column. Automated feeding works, but its settings have to follow the environment and the fish.
Turning data into daily decisions
The same records support four routine decisions:
- Set the ration. Start from the table rate for the measured temperature and the current biomass estimate, let an agreed meal-stop signal decide whether the fish take more or less, and log both figures.
- Catch appetite drops early. In Atlantic salmon, the first sign that oxygen supply is falling short is reduced appetite, followed by slower growth. FeedOptima's typical ranges put the level below which intake and welfare are limited at 7 mg/L for Atlantic salmon and 5.5 mg/L for rainbow trout. If oxygen and temperature are normal, look at health: in the fjord trial, salmonid alphavirus cut appetite in both groups of cages over winter.
- Compare planned and actual FCR. If FCR between samplings runs above plan while intake matches the table, suspect uneaten feed or a poor biomass estimate; if intake falls and FCR holds, the fish are simply eating less.
- Change diets on measured weight. FeedOptima's typical ranges for Atlantic salmon move from 38 to 44% protein and 28 to 35% lipid in grower feed for 300 to 2,500 g fish to 34 to 40% protein and 32 to 38% lipid in finisher feed, so switch on sampled weight, not the calendar.
The chart shows FeedOptima's planning ranges for feed-cost savings by strategy. These are assumptions for scenario planning, not measured results from any farm. Precision feeding acts mainly through two of the bars, improved feed conversion and waste reduction.
Starting on a small operation
A small farm does not need a sensor network to feed more precisely. A spreadsheet with one row per unit per day covers most of it: date, feed type and lot, table ration, amount actually fed, a feeding response score, water temperature, dissolved oxygen, mortalities and notes. Each sampling then gives an FCR for the interval.
If only one sensor is affordable, a logging temperature and oxygen probe in the unit most at risk is a sensible first purchase. With a handheld meter, readings at the same place and time each day make trends visible, which matters because oxygen can move from optimum to lethal within hours. For growth sampling, the trout guide suggests a sample count at least monthly above about 13 C, every 1 to 2 months in cooler water, and weekly for fry over the first 4 to 6 weeks. Over time, those growth records help predict seasonal growth on the site.
Limits and pitfalls
Biomass is the weakest input and the one every ration depends on. Frames and stereo cameras measure only fish that pass their location, and in 3 sea cages the fish recorded by frames at 3 m were 15 to 25% smaller than those at 6 and 9 m. In the fjord trial, even an optical counter underestimated fish numbers by about 2% on average against a manual count from video.
Sensors fail quietly. An oxygen reading is correct only when the meter has been calibrated, used correctly and maintained, and a single reading may mean little because oxygen varies with time and place, even in aerated tanks. A fouled probe raises no alarm; it simply feeds wrong numbers into every decision after it.
Models deserve the same caution. The precision fish farming framework notes that estimates combining models with sensor data are sensitive to both measurement errors and model flaws, and that handing decisions to software risks sub-optimal feeding when data on fish responses is limited. In the fjord trial, the echofed cages received about 6% less feed than the controls over autumn and winter, and that mild underfeeding cost growth. Keep a person reviewing the numbers, and treat any automated ration far from the table as a question to check.
In practice
- Get the supplier's feeding chart for the exact formulation, and record table and actual ration for every unit, every day.
- Write down the meal-stop rule each operator uses, such as pellets passing a set depth.
- Log temperature and dissolved oxygen at the same place and time daily, and check probes against a freshly calibrated reference on a fixed schedule.
- Sample weights on a schedule tied to water temperature, from more than one depth or location, and reconcile biomass against harvest weights.
- Flag any unit eating well below its table ration, and check oxygen, temperature and fish health before accepting the lower intake.
- Calculate FCR for each sampling interval and compare it with the plan, unit by unit.
- Move to the next diet on sampled weight, not on the calendar.
To set stage requirements and a recommended composition beside your own feeding records, use FeedOptima's free analysis and run an optimization.
Sources
- Precision fish farming: A new framework to improve production in aquaculture, Biosystems Engineering. https://www.sciencedirect.com/science/article/pii/S1537511017304488
- Deployment of hydroacoustic feeding control in salmon sea-cages; biological and technical considerations, Aquaculture. https://www.sciencedirect.com/science/article/abs/pii/S0044848622008171
- Reluctance of farmed Atlantic salmon to feed in cold water revealed during automated hydroacoustic feeding control, Aquacultural Engineering. https://www.sciencedirect.com/science/article/pii/S0144860925000548
- The oxygen threshold for maximal feed intake of Atlantic salmon post-smolts is highly temperature-dependent, Aquaculture. https://www.sciencedirect.com/science/article/abs/pii/S0044848616303970
- Sea caged Atlantic salmon display size-dependent swimming depth, Aquatic Living Resources. https://www.cambridge.org/core/journals/aquatic-living-resources/article/abs/sea-caged-atlantic-salmon-display-sizedependent-swimming-depth/0B49EF0C5F3B180F4B3EE2D3D7DF4FAB
- Trout Production: Feeds and Feeding Methods (SRAC Publication No. 223), Southern Regional Aquaculture Center. https://aquaculture.mgcafe.uky.edu/sites/aquaculture.ca.uky.edu/files/srac_223_trout_production_feeds_and_feeding_methods.pdf
- Measuring Dissolved Oxygen Concentration in Aquaculture (SRAC Publication No. 4601), Southern Regional Aquaculture Center. https://srac.msstate.edu/pdfs/Fact%20Sheets/4601%20Measuring%20Dissolved%20Oxygen%20Concentration%20in%20Aquaculture.pdf